Enable Debug Logging in Browser
- Maryna Pristrom
Owned by Maryna Pristrom
Last updated: Apr 01, 2018
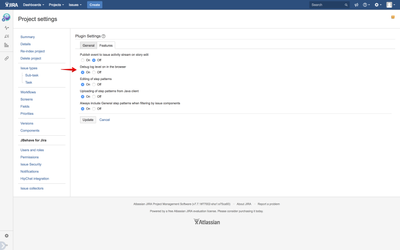
For cases when you might experience a UI related issue we are likely going to ask you to provide a Debug level log output from your browser, so that we can get more detailed information as to what might be happening. The debug level is turned off by default and needs to be turned on via the plugin configuration page, see how to access configuration page here.
The configuration item is titled 'Debug log level on in the browser', see screenshot below
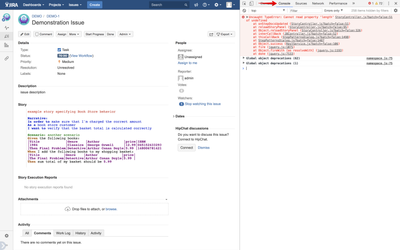
Once you have enabled it, then the plugin code will write much more detailed output to the browser log which you can access for example via Console tab in Google Chrome as shown below
, multiple selections available,